Diagnostics Overview
The Diagnostics module provides a range of details about screens and their performance. When you click Diagnostics, you should see a list of your screens and their current status. To see a snapshot of data about a specific screen, click on the screen from the left-hand menu.
You are able to adjust the snapshot information that is shown beneath the screen name by clicking the dropdown menu and selecting the detail you'd like to view.
If a field is truncated, you can hover your mouse over it to see the full name.
If you are viewing this module from a mobile device, you can click the Info icon for details about the controller, daemon and uptime.
Filter Options
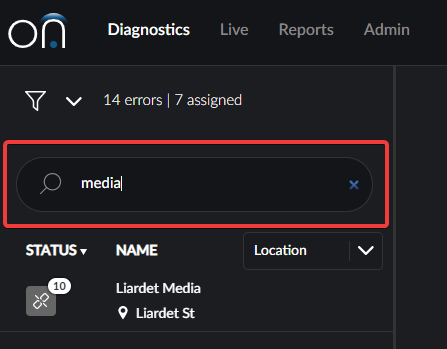
There is a search field where you can input the screen name, or part of the screen name, and it will filter the list. This can also be used to search for location names and screen IDs.
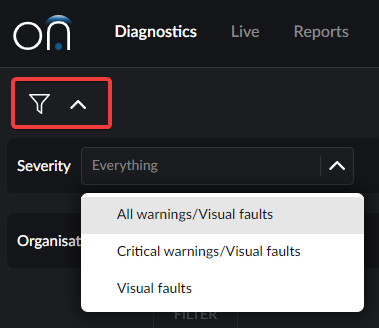
If you click the filter button, you will have the option to filter by error type. The default is that all error types will be shown (Warnings, Critical Warnings and Visual Faults). You may choose to only view Visual Faults as they are the most severe, or you may want to narrow it to just Critical Warnings and Visual Faults. If you want to save your filters, tick the "Remember filters" checkbox.
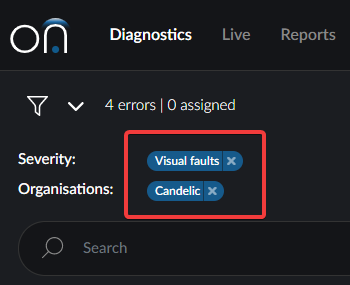
The filters will be displayed at the top. To remove a filter, just click the x beside it. If you manage screens for more than one organisation, you will also be able to filter by organisation.
Error Types
| Error Type | Colour | Description |
|---|---|---|
| Warning | Yellow | These errors indicate when operations are outside of the preset thresholds. They may not typically require immediate action but collectively, they may indicate an issue. |
| Critical Warnings | Orange | These errors indicate when operations heavily exceed the thresholds and although they may not require immediate action, they will need attention very soon to prevent a more severe fault. |
| Visual Faults | Red | These errors are likely to affect what is seen on the screen and will generally need immediate attention. |
Screen Status
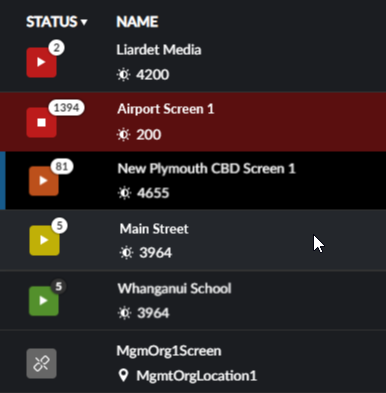
The Screen Status icon tells you at a glance whether your screens are playing, which ones have outstanding errors, and how many errors a screen has.
The number in the circle indicates the total number of errors for that screen.
The shape inside the icon provides information that tells you if the screen is playing.
| Shape | Description |
|---|---|
| Play button | The screen is playing. |
| Stop button | The screen has stopped playing. |
| Broken Link | The screen is not currently connected. |
The icon is colour-coded according to Error Type and represents the most severe error on that screen currently, even if there is only one at that severity.
The colours give a quick indication of which screens may need attention.
| Colour | Description |
|---|---|
| Green | The screen has no errors, or all of the errors have been assigned. |
| Yellow | The most severe error present is a warning. |
| Orange | The most severe error present is a critical warning, and there may also be warnings present. |
| Red | The most severe error present is a visual fault and there may also be critical warnings, and/or warnings present. |
| Grey | The screen is not currently connected. |
If a screen has stopped but is still connected, it will be highlighted in red as in the example above for Airport Screen 1.
If the errors have all been assigned then the circle with the number of errors will have a dark background, as in the example above for Whanganui School.
Compact View
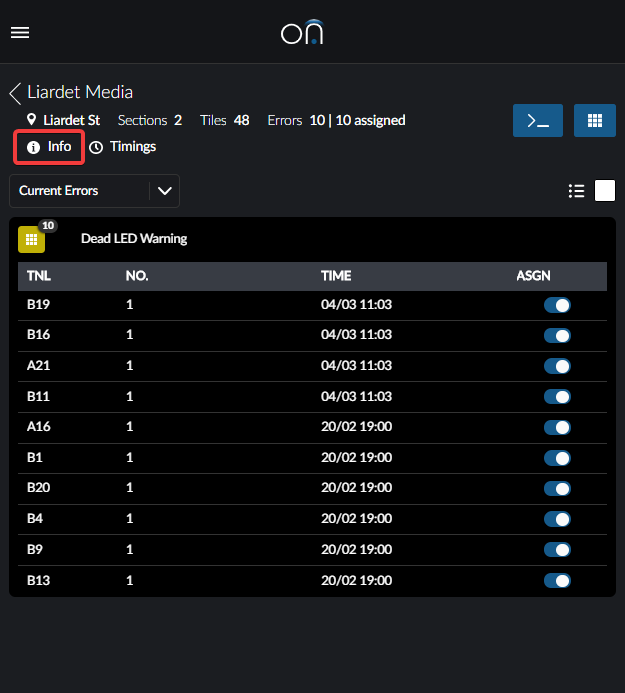
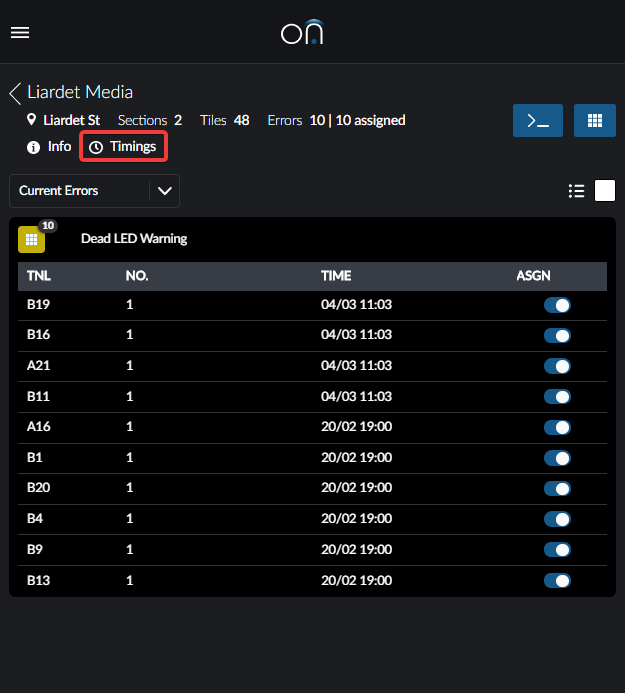
Once a screen is selected, detailed information about the screen and any errors will be shown. Hover over Timings to see more details about the timings. If you are viewing on mobile, tap Timings for this information.
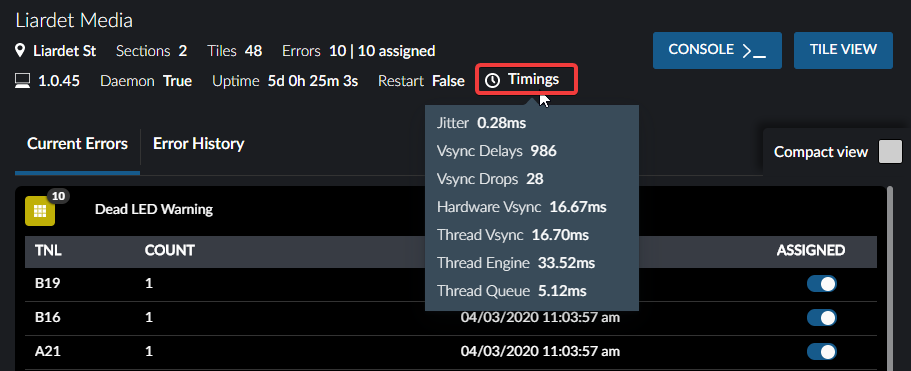
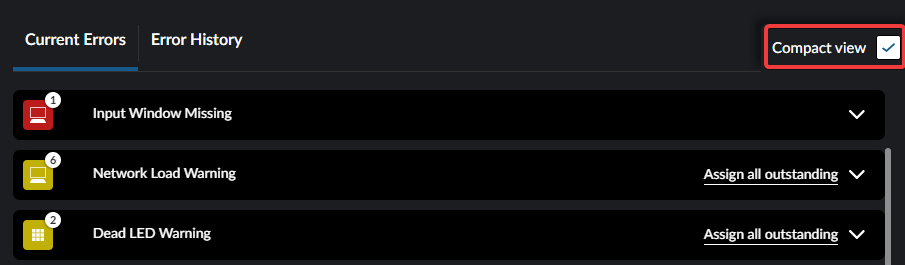
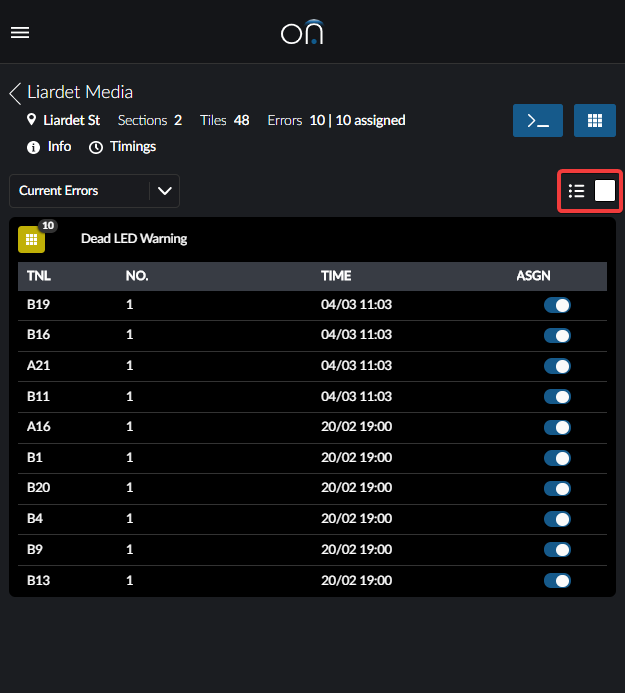
If you wish to collapse the list of errors to focus on just one type of error, click the Compact View checkbox and then select the error you wish to view. If you want to return to the expanded view, untick the Compact view checkbox.
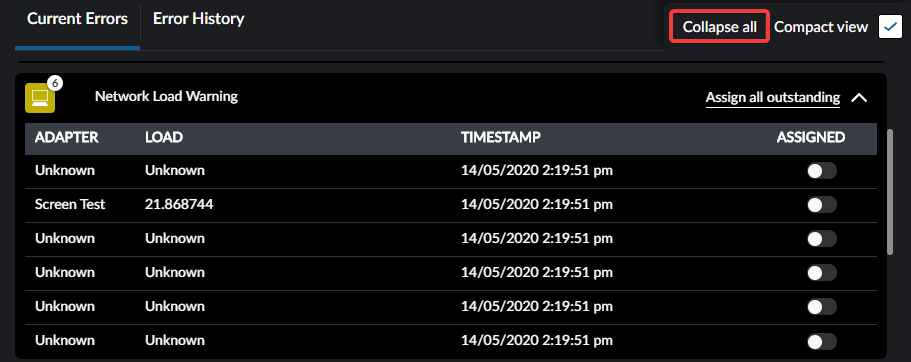
If you have been reviewing errors and want to return to the high-level list of errors, click the Collapse all button.
Assigning Errors
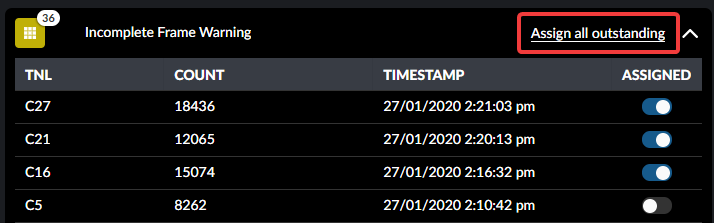
Errors can be marked to show as assigned so that you can see which errors need immediate attention and which are in progress. It doesn't provide functionality other than a visual cue and an event in the error history, but it can help you organise what needs to be resolved.
This can be done with individual errors or by clicking the Assign all outstanding button, which appears when there are outstanding errors.
Error Data
Each screen will have the last month of error data stored as history.
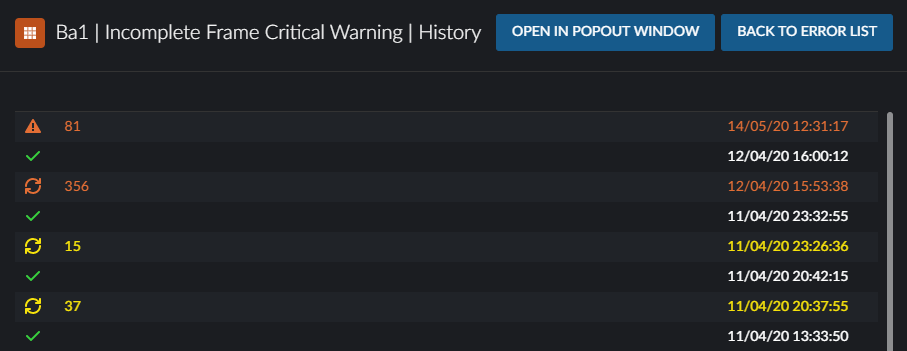
If you click on the line for a current error, you can view the history for that specific error including when it appeared or recurred, when it was assigned (blue) and when it was resolved. If the severity of that error is upgraded or downgraded, you will also see these status changes in the history.
Error History
You can access a detailed error history from the Error History tab.
This allows you to narrow down errors to a specific timeframe where something went wrong. You can filter it to show all errors of a particular severity level, or a specific error code.
Choose the date range by clicking onto one of the preset timeframes, or by selecting specific dates and times. You can view a maximum of one-month of data for any given search.
Choose the error code if you wish to narrow it down and then click Apply.
Your results will be shown on screen.
Console
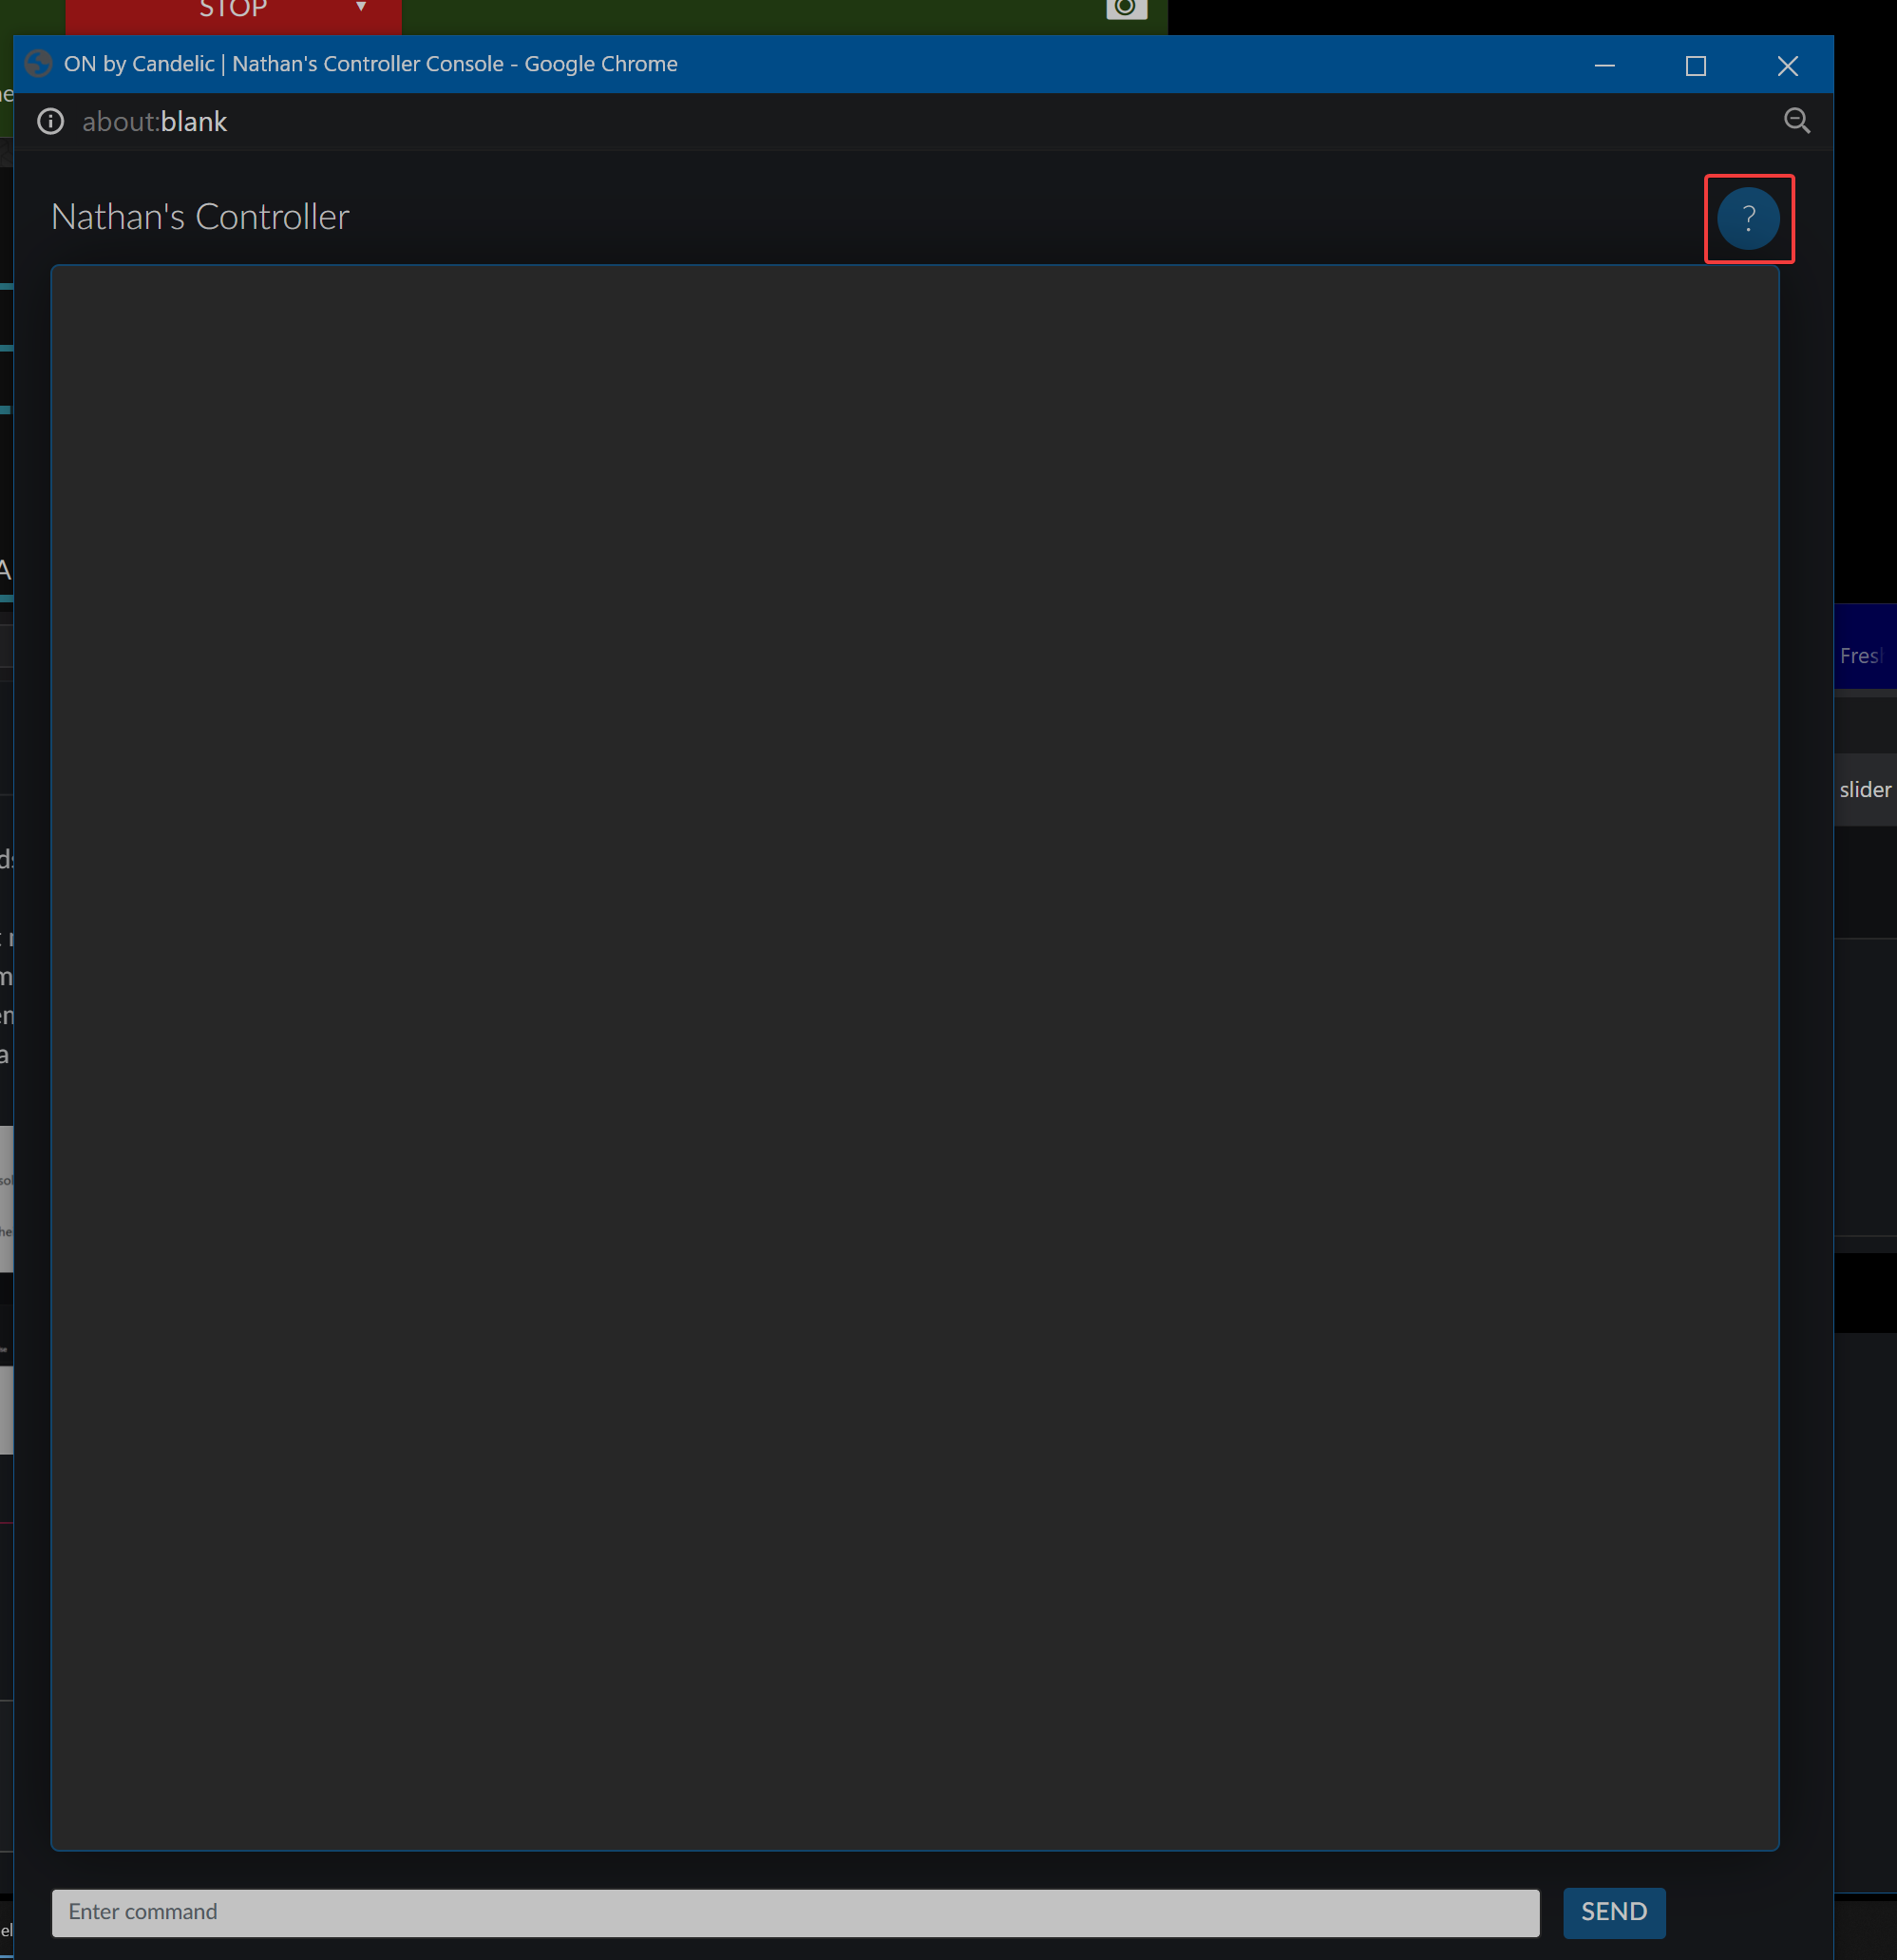
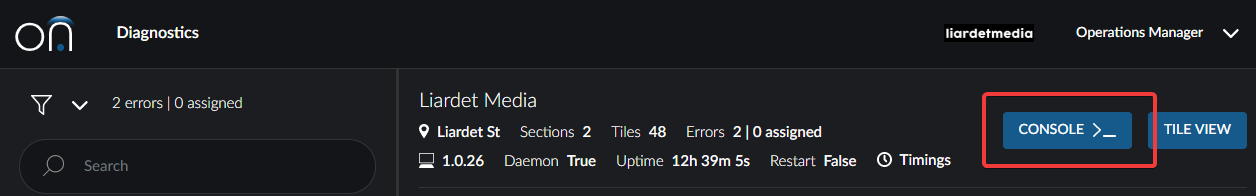
For advanced troubleshooting, some users will have access to the Console.
Users can access the Console by clicking the blue Console button for their screen. If you do not see the button, this access is not available with your account type.
To access the Console manual, click the blue question mark at the top right of the console window.